DATA ANALYTICS
TEXT DATA ANALYSIS
Word Cloud and Network graph analysis
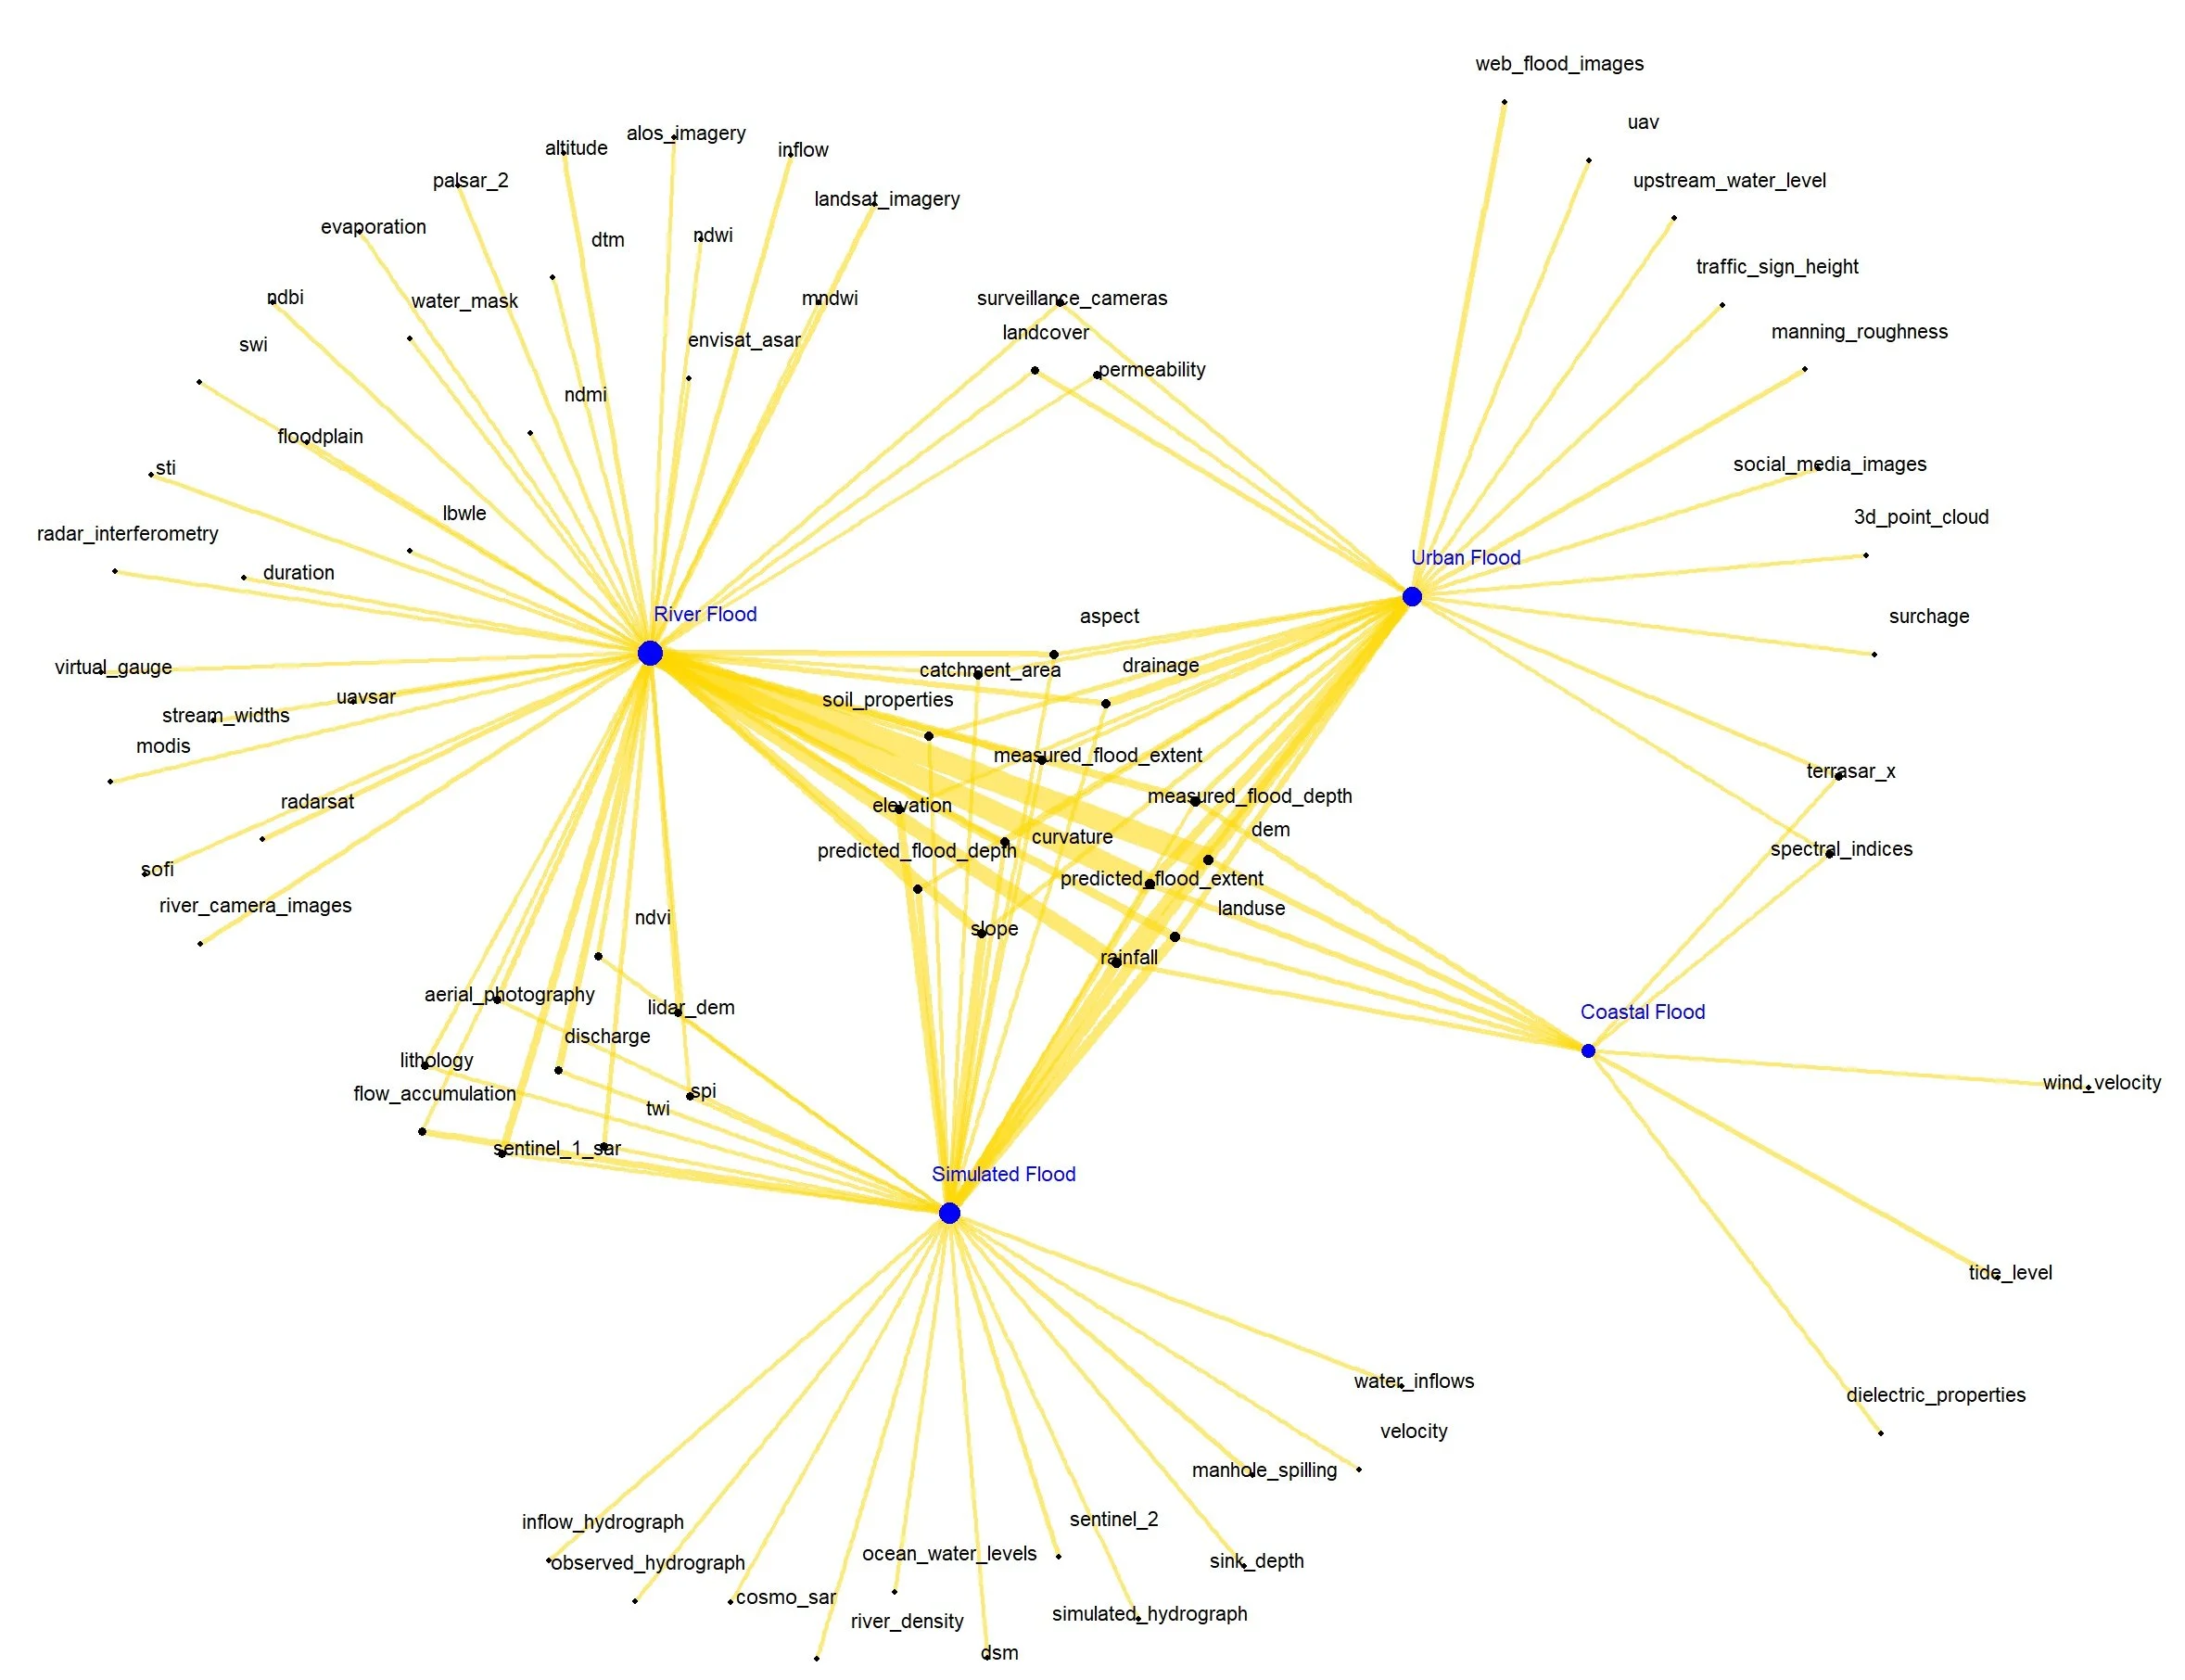
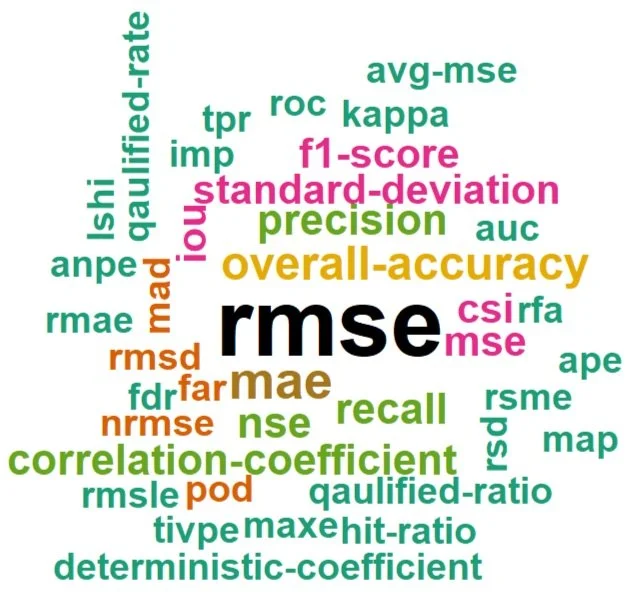
Objective: To extract, process and analyze flood extent methods and evaluation metrics from research papers on floodwater depth estimation using word cloud. Additionally, to examine and highlight the interaction between flood types and data variables for estimating floodwater depth.
Method: Utilized R libraries, including wordcloud2, tidyverse, tidygraph, tibble,FactoMineR, dplyr, and ggplot, to extract, process, analyze and visualize the data.
Outcome: Successfully identified and visualized the predominant metrics. Furthermore, quantified and illustrated the interaction between flood types and data variables critical for estimating floodwater depth.
Network graph showing relationship between flood types and data variables
Word Cloud visualization showing predominant evaluation metrics.
Word Cloud visualization showing predominant flood estimaton methods
MULTIVARIATE DATA ANALYSIS WITH R
Environmental Index Prediction with General Linear Model (GLM)
Objective: To analyze the international Social survey program on the Environment from 2000, with 31000 individual responses across 38 countries, for two-way anova/GLM predictions for environmental index.
Method: Utilized the car library in R to process, analyze and visualize data for predictions.
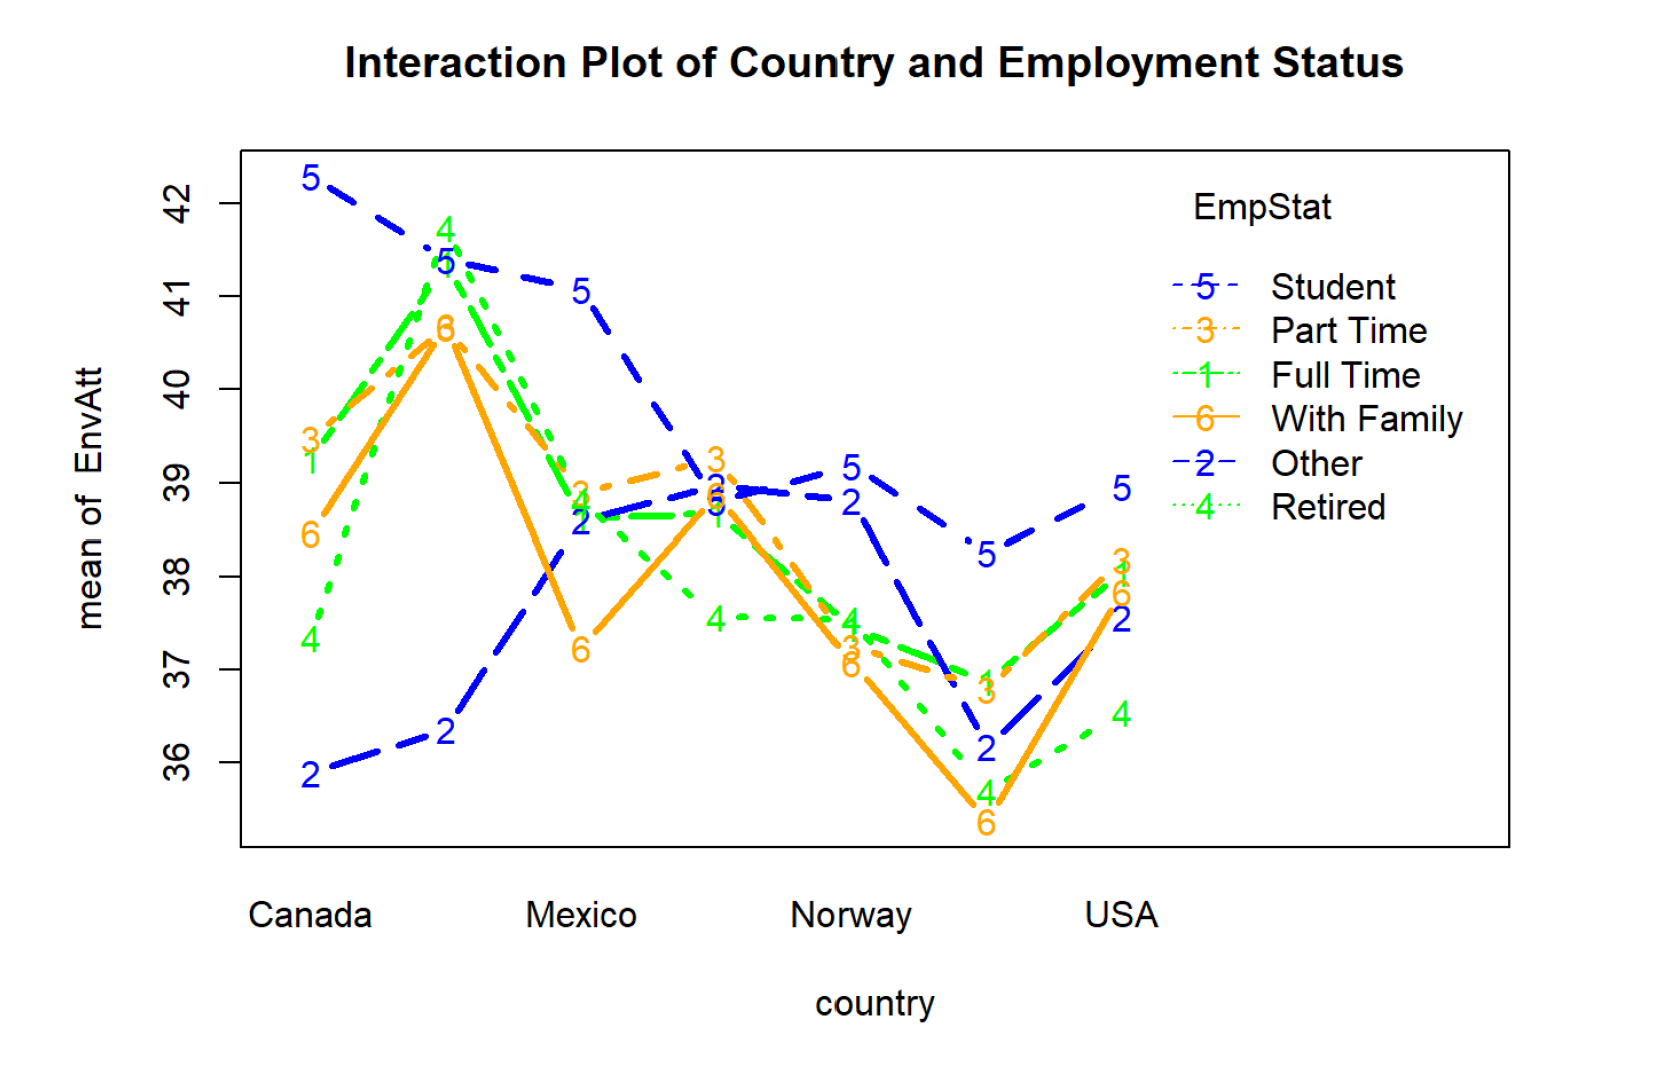
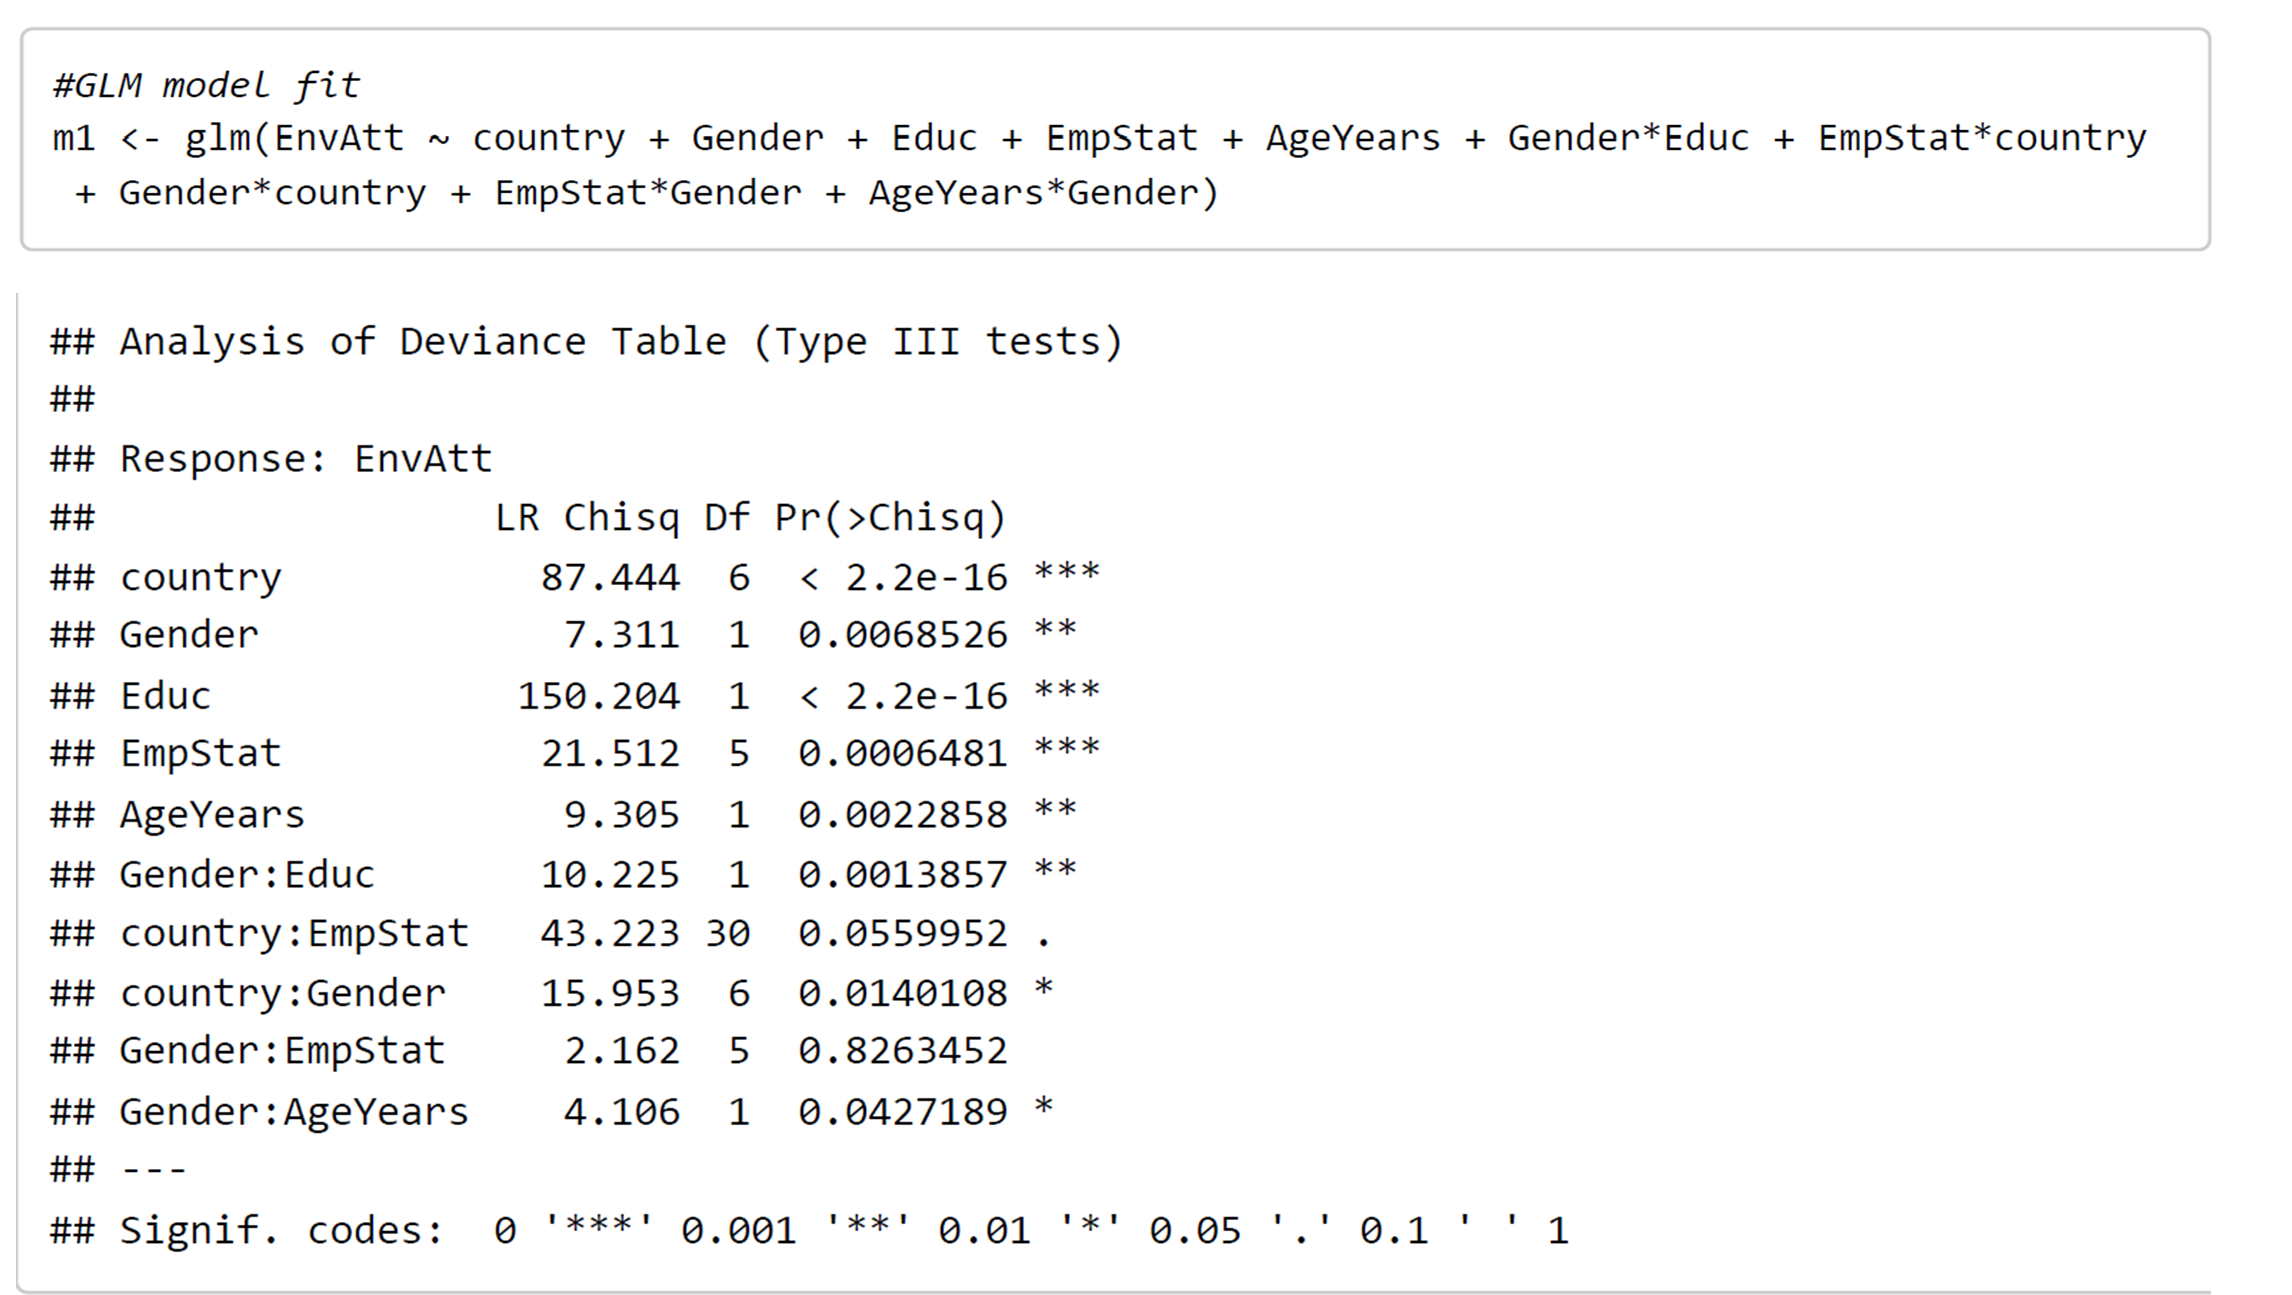
Outcome: Identified and highlighted the important continuous (2) and categorical (3) indicators for predicting environmental index. Education, Age, Gender and Country were significant predictors of environmental index.
Interaction plot to analyze the relationship between indicators.
Sample code and results from the General Linear Model (GLM) analysis in R
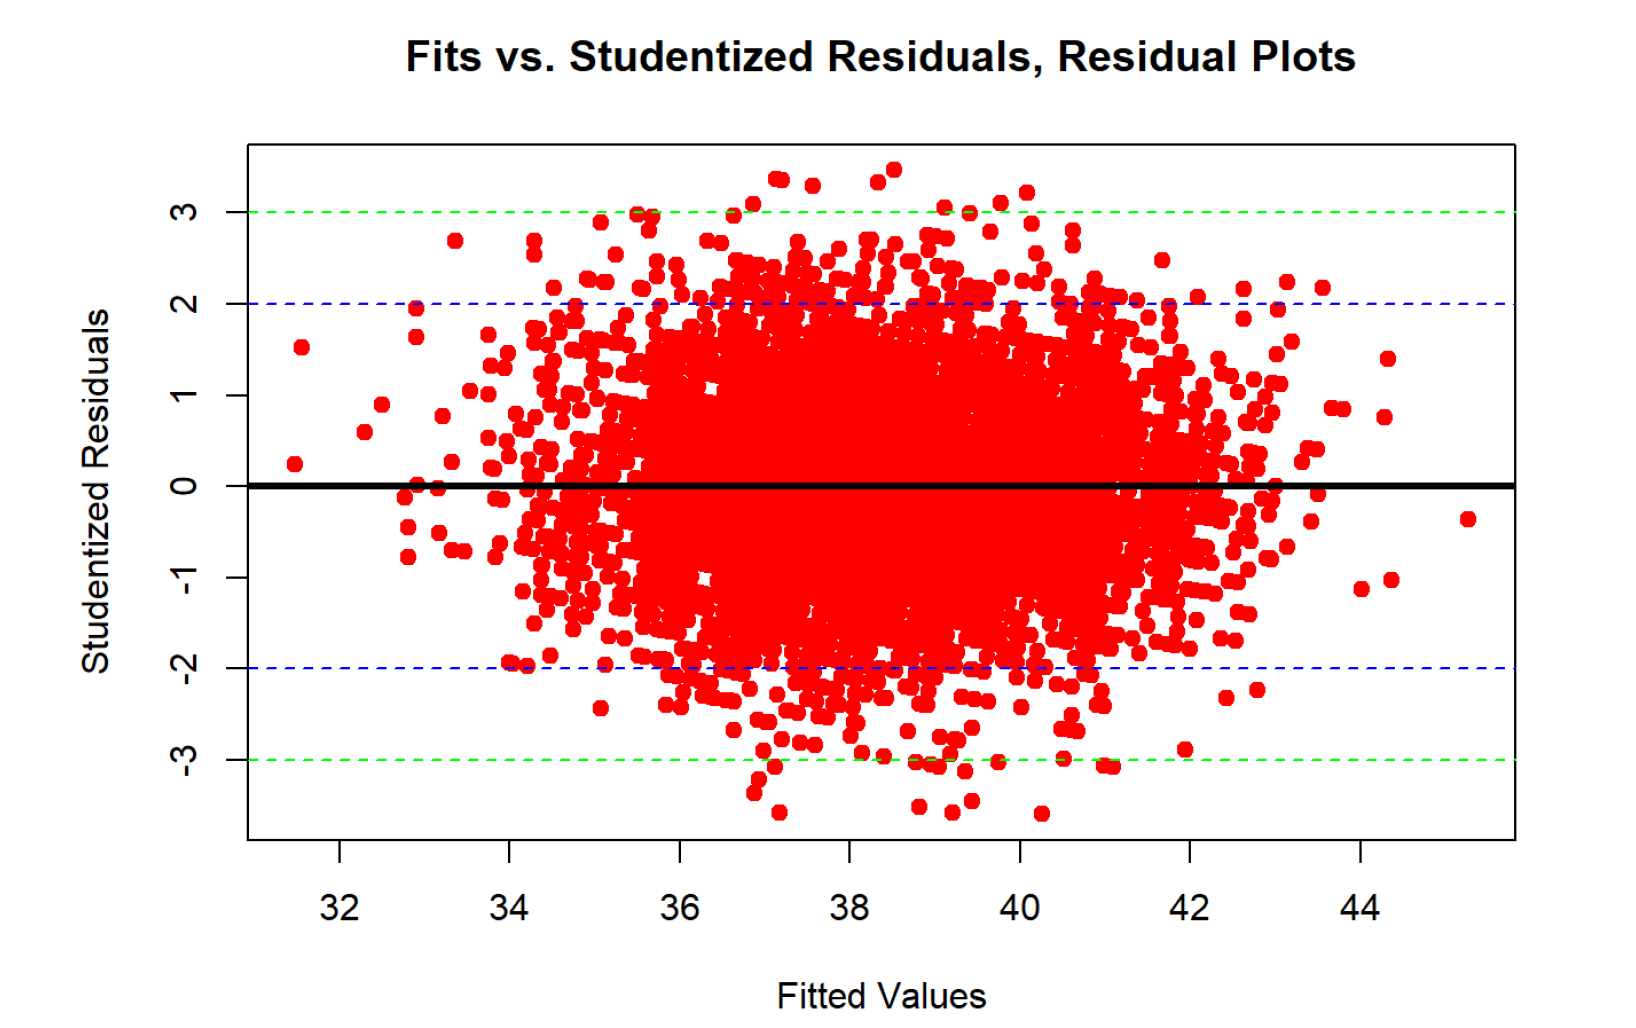
Residual plot for best fit model
Profit Return on Movie genres with one-way ANOVA
Objective: To compare mean percent return(revenues/budget * 100) between movie genres using the 6 most prevalent genres from a custom movie dataset.
Method: Utilized the lattice, plotrix and car libraries in R to process, analyze and visualize the data.
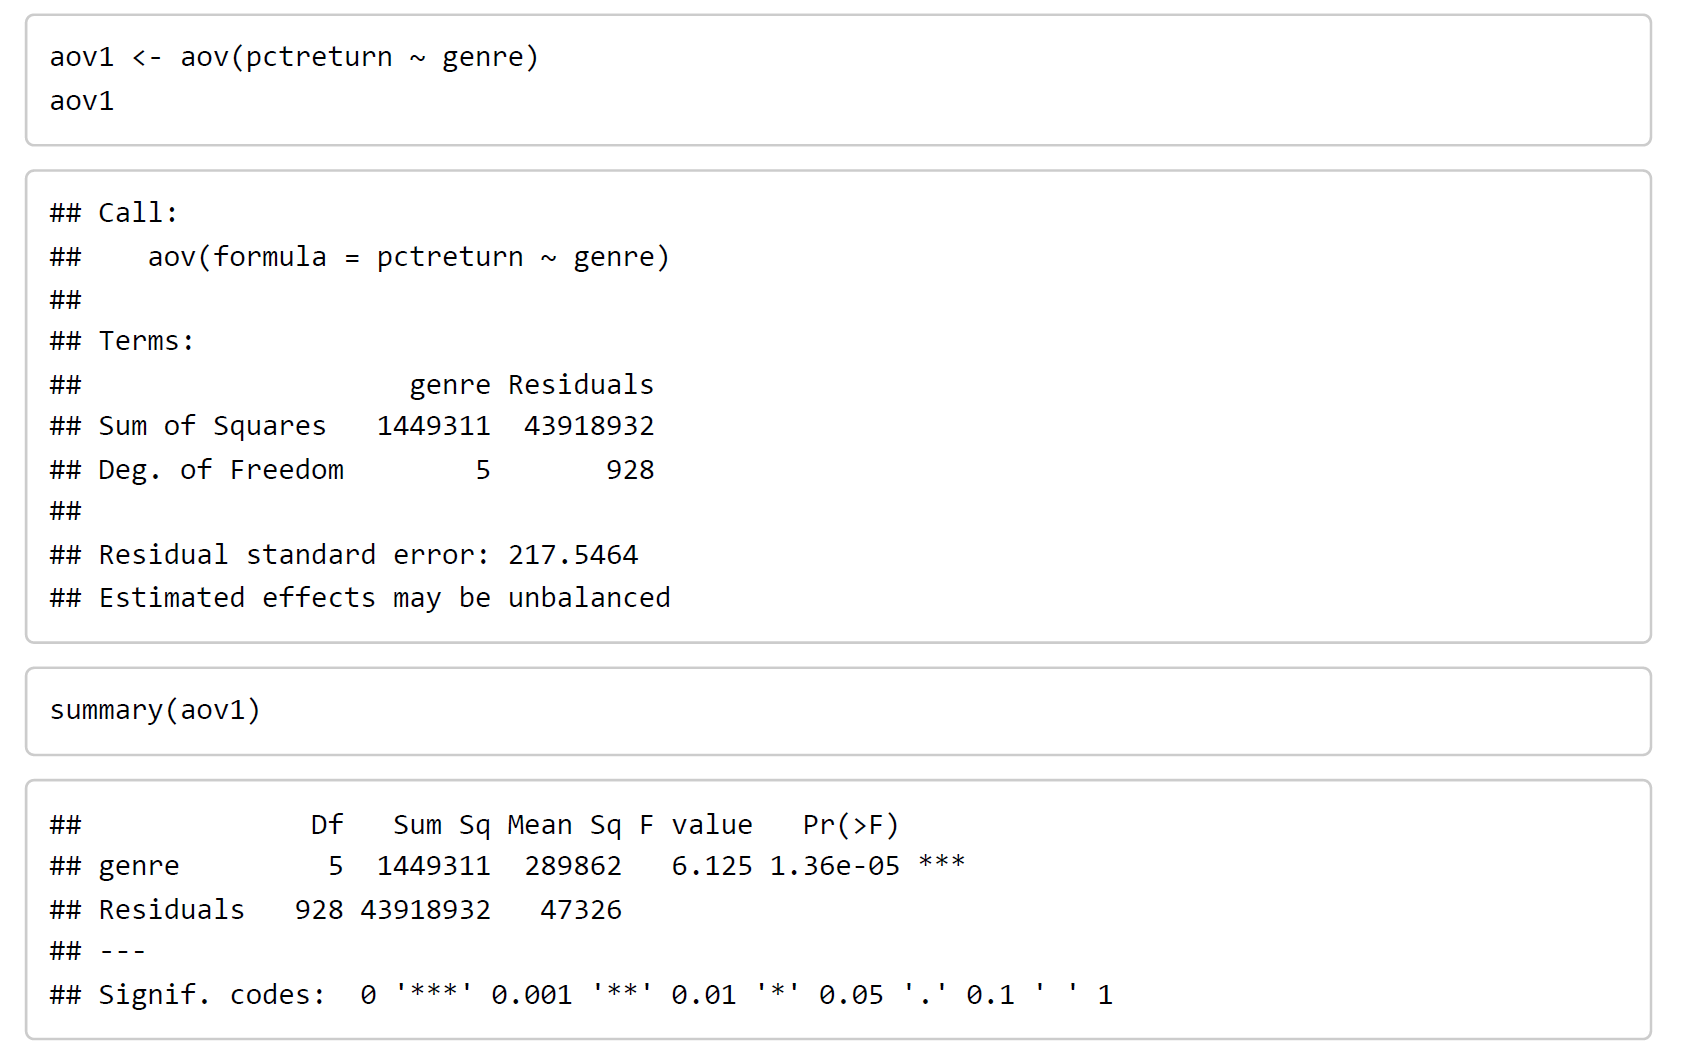
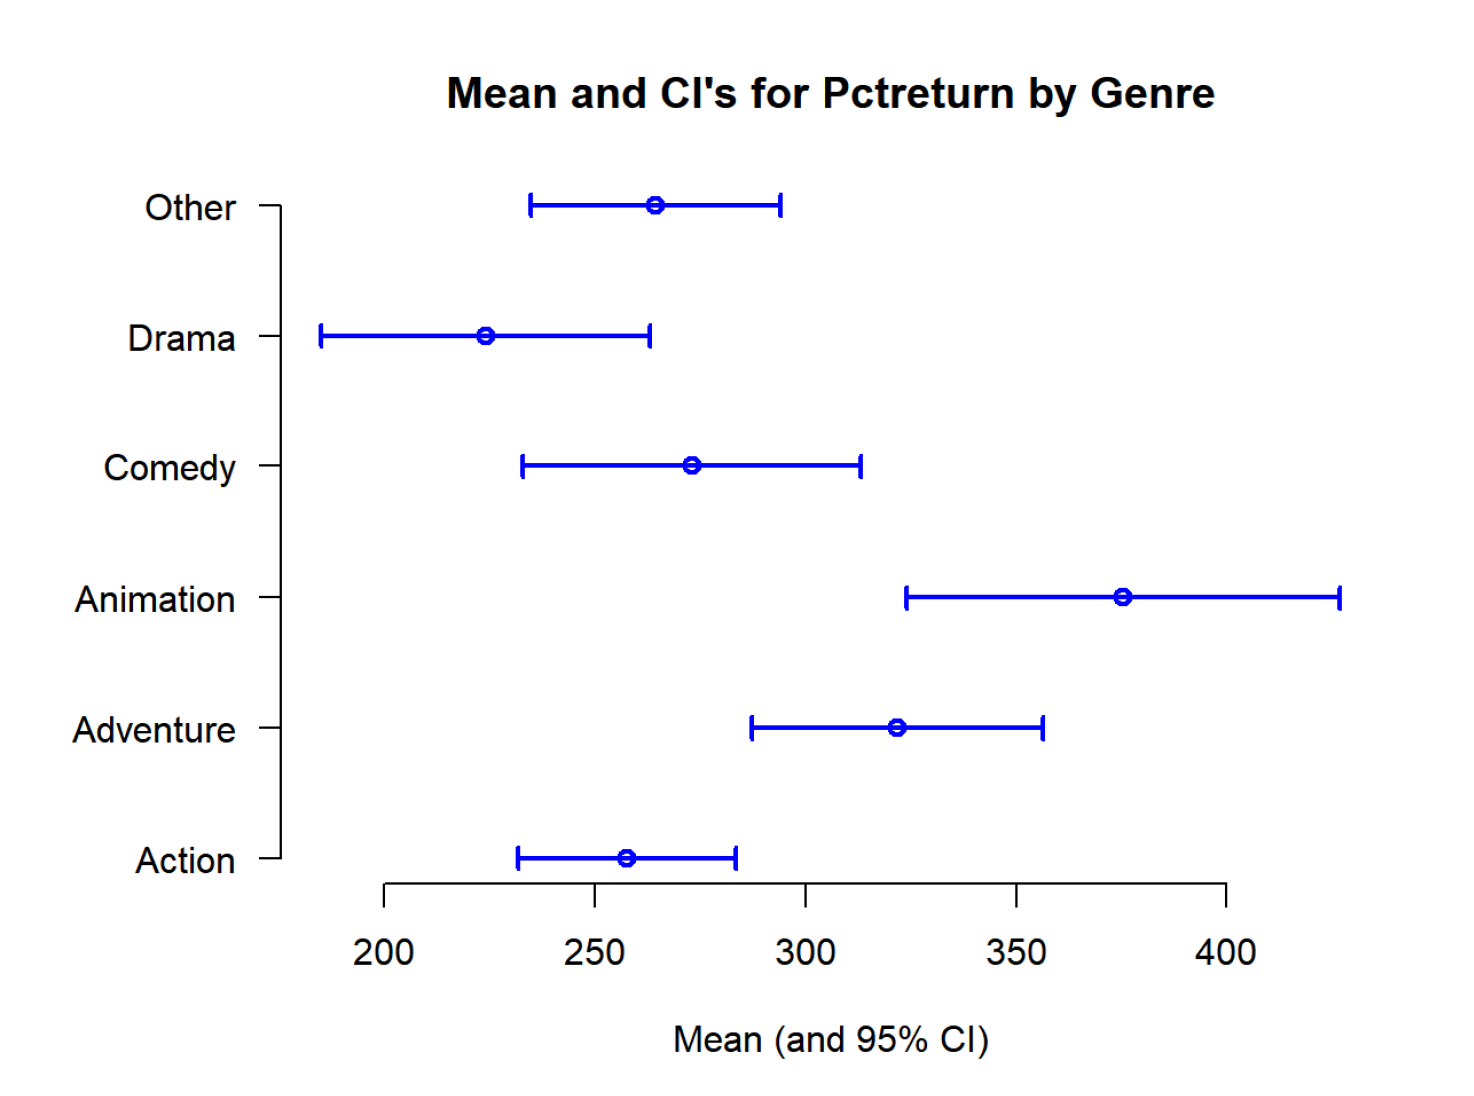
Outcome: Identified a statistically significant difference in percentage return between the various genres.
Strip plot showing relationship between percentage return and movie genres.
Sample code and results from the anova analysis in R
Mean and Confidence Interval plot
