REMOTE SENSING/ GEOGRAPHIC INFORMATION SYSTEMS PORTFOLIO
NASA/NOAA FLOOD MAPPING PROJECT
This study investigates an approach to map 3D flood map (i.e., floodwater extent and depth) using UAV high-resolution imagery and LiDAR for Hurricane Matthew. We utilize a deep learning approach to map flooded area extent from post-event UAV images, and then employ spatial statistics to estimate the water level depth of the flooded areas leveraging on the corresponding DEM. Afterward, a built-up surface auxiliary dataset was combined with the generated flood depth result to map and analyze flood impact risk in settlement areas within the Town of Grifton, NC during Hurricane Matthew. Our results showed that settlement areas in Grifton exhibit different risk levels from a 3D flood depth perspective. This information could significantly enhance near real-time emergency response strategies, as well as future adaptation and mitigation initiatives.
MAPPING HISTORY PROJECT
Objective: To identify plantation farms most at risk of infestation from nearby swamps.
Method: Conducted proximity analysis to classify farms into high, neutral, and low-risk categories based on distance.
Outcome: Provided a risk assessment framework to support mitigation efforts.

Farm planation infestation risk map

Statistics chart showing the number of farm plantations at each risk level. 39% of the total farm plantations (159) within the indianwoods territory were highly at risk of the swamp infestations.
URBAN GREEN PROJECT & SPATIAL MAPPING
Objective: To support community led green initiatives through spatial mapping.
Method: Planted trees, created walk paths in public parks, and mapped projects using ArcGIS Pro and Field Maps.
Outcome: Improved urban green spaces and created a geospatial record of initiatives.

Tree planting initiative; Watson and Basset street, New Haven , CT

Tree and shrub planting initiative; Kensington Park, New Haven , CT

Park management and restoration; Fairmont Park, New Haven , CT
GREEN DEVELOPMENT ANALYSIS
Objective: Investigated the development trends in New Haven to inform the creation of a Green Ordinance for sustainable growth.
Method: Analyzed data from the City Plan Commission (CPC) and the Board of Zoning Appeals (BZA) to examine neighborhood-level development trends.
Outcome: Identified development patterns and their implications for New Haven’s green initiatives and zoning regulations.
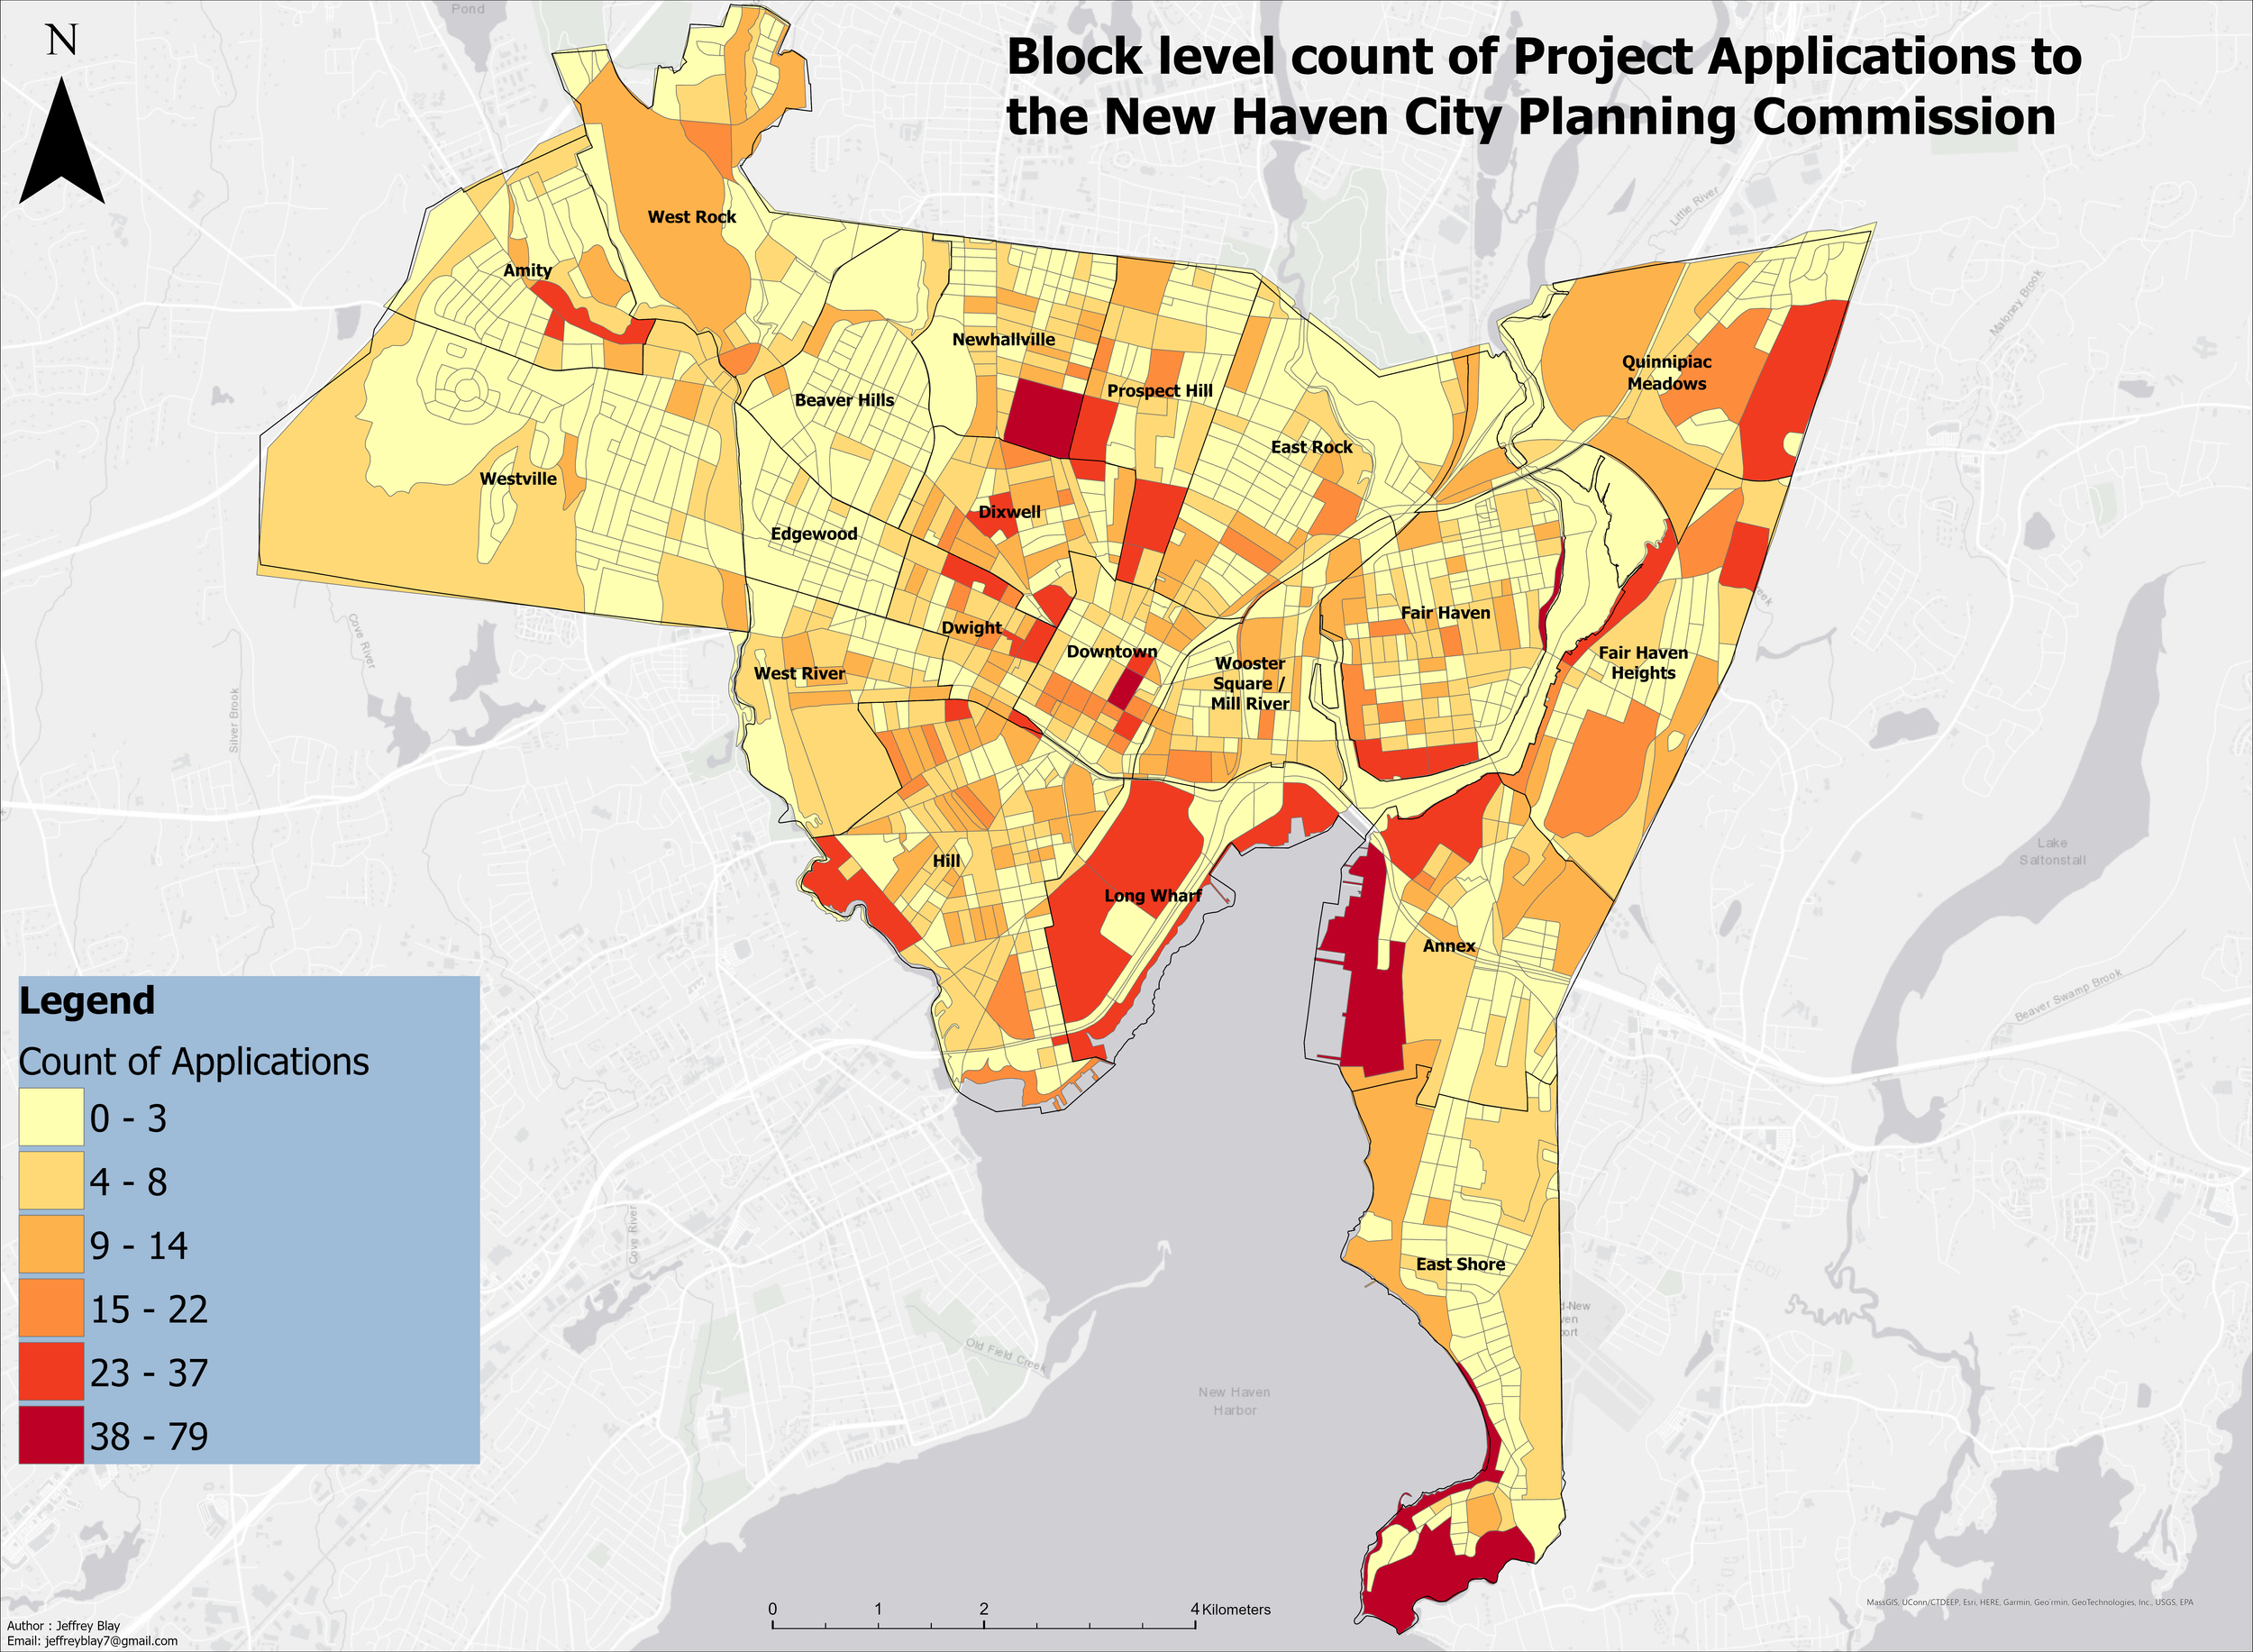
Map showing counts of development project applications per census block

Special exceptional approvals per neighbourhood over time

Site plan approvals per neighbourhood over time
NASA ENVIRONMENTAL JUSTICE PROJECT
Objective: To assess urban heat and tree canopy cover in New Haven for better urban planning.
Method: Performed block-level analysis of street trees and compared temperature and NDVI with built environment data in New Haven, CT.
Outcome: Provided geospatial insights to guide tree planting initiatives by analyzing urban heat and tree canopy distribution.

Building counts and mean temperature (avg. 2022) per census block. This was to identify if blocks with higher building counts have a higher mean surface temperature compared to the surrounding blocks.

Number of buildings per block. This is to help identify blocks with higher impervious surfaces or concentration of activities.

Comparative analysis of street trees and building counts per census block. This was to identify whether census blocks with high building counts have more street trees.
Lidar Point Cloud Analysis
SPATIAL ANALYTICS
Objective: To estimate building heights using 3D point cloud data.
Methodology: Processed LiDAR point cloud datasets in ArcGIS Pro.
Outcome: Generated accurate building height estimates for campus structures.
Fire Emergency Response Optimization
Objective: Analyzed fire truck accessibility and response times in Accra, focusing on Katamanto Market.
Method: Mapped optimal fire truck routes and evaluate fire station coverage against NFPA standards.
Outcome: Identified gaps in coverage, showing fire stations exceeded the NFPA standard distance, potentially affecting response times.

Fire truck routes analysis
Census Enumeration Optimization
Objective: To identify difficult-to-enumerate areas for the 2021 Census for the 2021 Population and Housing Census.
Methodology: Analyzed and combined building footprints, road networks, and population counts in ArcGIS Pro to determine enumeration difficulty levels.
Outcome: Helped allocate resources to challenging areas for better census planning.

Response Time analysis

LiDAR 3D point cloud for buildings.

Results for 1 enumeration area.
Flood depth data for AI algorithms
DATA COLLECTION AND ANALYTICS
Objective: To create a comprehensive datasets for training and evaluating AI algorithms to predict post flood depth.
Methodology: Utilized ArcGIS Pro and Arcpy to process and analyze aerial imagery and 3D point cloud.
Outcome: Generated flood datasets with 10,000 256 by 256 tiles.
Real-Time Spatial Data Collection & Monitoring
Objective: Designed an efficient field data collection system for gathering ground truth data on 600 buildings in Ghana.
Method: Used ArcGIS Pro, Online, Field Map, and Information dashboard to design, develop and deploy data collection and monitoring pipelines for collecting and monitoring field data in real-time.
Outcome: Improved efficiency, data organisation, real-time monitoring, and preliminary analysis of collected data.
Urban Africa Project
Objective: To estimate and analyze building infrastructures with AI across cities in Africa.
Methodology: Processed 60,000 OSM building footprints into raster masks using QGIS, ArcPy and R for model training.
Outcome: Created building density datasets for training deep learning algorithms.

ArcGIS Field Map app

Information Dashboard for real-time monitoring and preliminary analysis

OSM building footprint in 30 sq.m grids
3D Visualization of building footprint, 30 sq.m grids, and raster mask.

Created raster mask showing building area coverage per 30 sq.m
